How to find and tell your story
26.5K views | +0 today
Follow
How to find and tell your story
Discovering the art of storytelling by showcasing methods, tips, & tools that help you find and tell your story, your way.  Find me on Twitter @gimligoosetales
Your new post is loading...
Rescooped by Kim Zinke (aka Gimli Goose) from Digital Storytelling
Scoop.it!

Storytelling with Data Visualization | Kurtosys

Storytelling with Data Visualization | Kurtosys | How to find and tell your story | Scoop.it

"I had the pleasure of attending a Guardian Masterclass in London — one specifically about Data Visualization for journalists, designers and marketers. Presented by both an editorial director and an art director, it covered both the story and the graphic design aspects, and the core theme of the course addressed a simple question – does your data tell a story and can you visualize it?"


Read the full article to find out more about infographics and:

  • history
  • matching stories to data
  • tips on visualizing data
  • putting data into context
  • what if there is no story in my data?

Via José Carlos
Kim Zinke (aka Gimli Goose)'s insight:

So it turns out infographics really aren't a that new, especially to the world of storytelling.  Some wonderful examples of historical and new uses.


The categorization and examples of infographics into these 5 areas was very helpful:

  1. illustrative
  2. proportional
  3. timeline
  4. map
  5. list
Dianita Páez's curator insight, May 14, 2015 1:23 PM

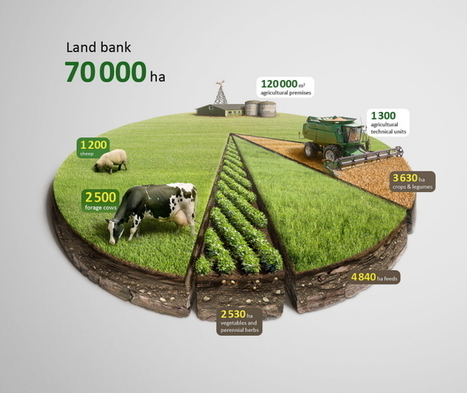
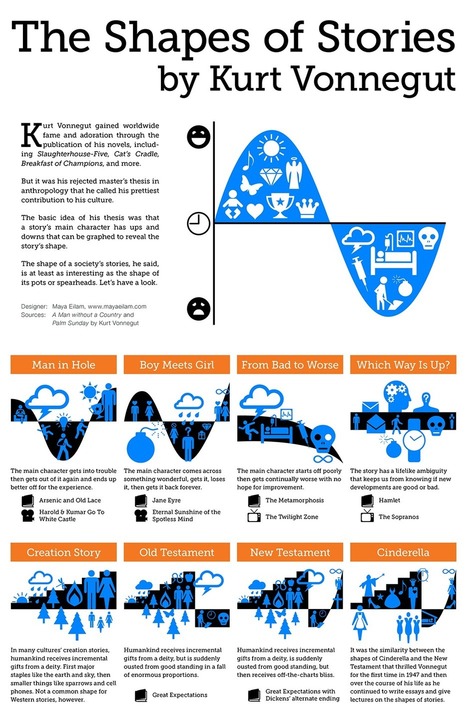
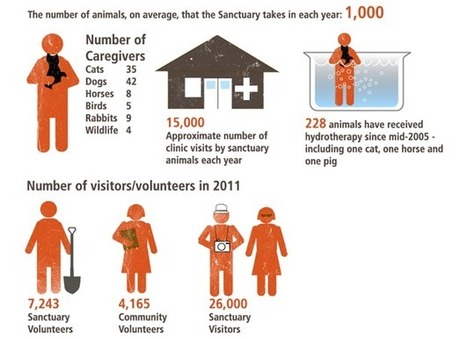
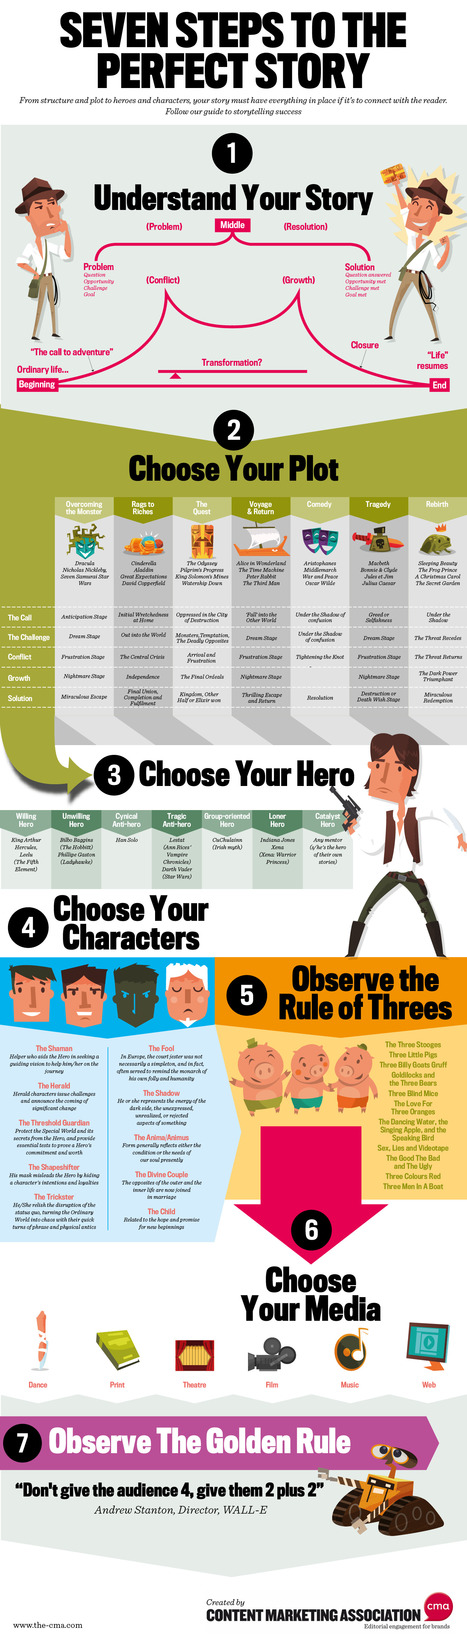
Infografías que cuenten historias. 

Davies Blake's curator insight, May 28, 2020 1:40 PM
buy stiizy pod

buy smartbuds

buy pre rolls 10

thca diamonds free!!

facts of white widow

Foreverkush.com has a 30% discount going on from 1st till the 15th of April due to the outbreak of corona virus. please stay home place, your orders
Scooped by Kim Zinke (aka Gimli Goose)
Scoop.it!

Story shapes, the imagination, and visual storytelling resources | Working Narratives

Story shapes, the imagination, and visual storytelling resources | Working Narratives | How to find and tell your story | Scoop.it

"Novelist Kurt Vonnegut’s rejected master’s thesis described the shapes of stories. Here, graphic designer Maya Eilan makes a clever infographic out of Vonnegut’s thesis. Or if you prefer, here’s a 5-minute video of Vonnegut himself giving a talk, in his signature funny style, about the idea."


This infographic demonstrates Vonnegut's belief that a story's main character has ups and downs that can be graphed to reveal the story's shape:

  • man in hole
  • boy meets girl
  • from bad to worse
  • which way is up?
  • creation story
  • old testament
  • new testament
  • Cinderella
Kim Zinke (aka Gimli Goose)'s insight:

I love infographics and I appreciate the inclusion of examples.


And be sure to check out the full article and read the section titled "Visual Storytelling for Change-makers."  It includes some great links to visual storytelling and infographics resources.

Dave Wood's curator insight, March 8, 2014 4:56 PM

What shapes are the stories of your visual coaching clients. This article reinforces the value of creating visual life histories and their impact on self narratives.

Scooped by Kim Zinke (aka Gimli Goose)
Scoop.it!

Nonprofit Storytelling with Infographics | John Haydon

Nonprofit Storytelling with Infographics | John Haydon | How to find and tell your story | Scoop.it

People support your organization for one reason: They view your organization as the agent of change they seek.  If they had the resources, they’d make the changes they desire by themselves. But they don’t, and that’s why you’re in their lives.  So when you tell the story of your cause, you need to show how supporters ultimately create the outcomes.


One powerful way to tell your orgs story is with an infographic. Read the full article to find out more about these five tips for creating effective infographics:

- keep it simple

- make it beautiful

- make it easily shareable

- put it everywhere

- promote it

No comment yet.
Scooped by Kim Zinke (aka Gimli Goose)
Scoop.it!

Seven Steps to the Perfect Story | Content Marketing Association

Seven Steps to the Perfect Story | Content Marketing Association | How to find and tell your story | Scoop.it

From structure and plot to heroes and characters, your story must have everything in place if it's to connect with the reader. Follow this infographic / guide to storytelling success.

No comment yet.
Scooped by Kim Zinke (aka Gimli Goose)
Scoop.it!

The Marketing Guide for Infographics | Score

The Marketing Guide for Infographics | Score | How to find and tell your story | Scoop.it

Infographics help viewers visualize data and then gain meaning in a fast and fun manner. No wonder that infographics are showing strong results in terms of interest and sharing.


Read the full article to find out what to provide this designer with the following decisions and information:

- Branding

- Production

- What are your goals

- Target audience

- What is your main point or question you wish to answer

- What is your story

- What data supports the story

- End result

- Distribution

No comment yet.
Scooped by Kim Zinke (aka Gimli Goose)
Scoop.it!

Free Template: Easily Create Infographics in PowerPoint | HubSpot

Free Template: Easily Create Infographics in PowerPoint | HubSpot | How to find and tell your story | Scoop.it

[GG:  This will appeal to those who are into visual storytelling.  The download is a 24 slide PowerPoint file]


Infographics are becoming a popular tool that marketers use to capture the attention of their target audiences. You’ve seen them shared on blogs and social media sites -- and their visual appeal is indisputable. The only question is, how do you actually make one?


Download HubSpot's free template for an easy way to create and design professional-looking infographics in PowerPoint.

No comment yet.
Scooped by Kim Zinke (aka Gimli Goose)
Scoop.it!

Tell Your Library Story with Infographics | Nebraska Learns 2.0

Tell Your Library Story with Infographics | Nebraska Learns 2.0 | How to find and tell your story | Scoop.it

Infographics is short for information graphics. They are graphic visual representations of information, data or knowledge. These graphics present complex information quickly and clearly. And they have become prevalent not just on the internet, but in print newspapers and magazines as well.


The thought of attempting to create an infographic yourself can be intimidating. But luckily, there are free, easy-to-use tools available that can help someone with virtually no graphic design skills (like me!) create interesting, dynamic, and informative infographics.


Read the full article for more information on the following tools:

- Infogr.am

- Visual.ly

- Piktochart

- further resources

- and an assignment to get you started on your first infographic

No comment yet.
Scooped by Kim Zinke (aka Gimli Goose)
Scoop.it!

40 Infographic Story Telling Resources | Tech4Him

40 Infographic Story Telling Resources | Tech4Him | How to find and tell your story | Scoop.it

Whether you are a nonprofit or a small business, you can't deny that infographics are a hot item. Used the right way, they can help tell compelling stories to generate interest or action on topics, for fundraising or organizational mission awareness. We have gathered 40 resources from around the web to help you in creating infographics or displaying compelling data in interesting ways.

No comment yet.
Scooped by Kim Zinke (aka Gimli Goose)
Scoop.it!

The Art of Storytelling (Infographic) | Adaptive Iterations

The Art of Storytelling (Infographic) | Adaptive Iterations | How to find and tell your story | Scoop.it
via flickr.com Love this set of doodles from Sunni Brown on the art of storytelling by Robert McKee. All businesses should take the art of storytelling seriously, it really can set you apart from the competition.


There are great points about story here for every business person. I particularly like, "Don't imitate anyone," and "It's not language, it's far beyond that."


Keep this one for your infographics file :)

No comment yet.
Scooped by Kim Zinke (aka Gimli Goose)
Scoop.it!

How To Be a Great Storyteller | Infographic List

How To Be a Great Storyteller | Infographic List | How to find and tell your story | Scoop.it

Step by step storytelling instructions.

Martin (Marty) Smith's curator insight, March 22, 2014 12:15 AM

I like this presentation as it seems more engaging, but it bears little relation to crafting stories in a business setting. I hear several problems over and over including:

* What we do is boring, no one will care.
* We don't have writers or storytellers on staff.
* We are too busy doing our jobs making widgets.
* No one does this in our space.

Excuses go on from there. Stories are how we learn best. Why then do we resist telling stories in a business setting. Do we really need to make things boring and uninteresting in order to make them "fit" in a business setting?

These "objections" are FALSE because:

* Everything is exciting when you explain it in story form.
* You may not have writers but you have storytellers. FIND THEM, grab a video camera or a phone with a video camera create a video diary.
* Your biggest job, no matter who you are, is to win hearts and minds, Stories, storytelling and online engagement is your job whether you realize it or not.
* No one is doing this in your space YET.

Great Scoop by Jack. Marty

Scooped by Kim Zinke (aka Gimli Goose)
Scoop.it!

Common Fairytale Narratives | Visual.ly

Common Fairytale Narratives | Visual.ly | How to find and tell your story | Scoop.it
Boy meets girl, girl goes into forest, finds house, escapes, finds boy again, happy ever after.
Kim Zinke (aka Gimli Goose)'s insight:

When it ain't broke, don't fix it.

No comment yet.
Scooped by Kim Zinke (aka Gimli Goose)
Scoop.it!

How You Can Use Infographics to Tell a Story | Social Media Club

How You Can Use Infographics to Tell a Story | Social Media Club | How to find and tell your story | Scoop.it

Defined as “graphic visual representation of data, knowledge or information,” Infographics are being used in a variety of ways to tell a story.


Like everything on the web, the ‘good, bad and ugly’ of Infographics are all too apparent. Whether you use software such as Adobe Illustrator or use free infographic creator tools, knowing the do’s and don’ts of Infographic design is key.


Here are some suggestions on how to design your information to be heard, felt, seen and acted on:

1, Define your goals.

2. Research your data and provide fair and balanced information.

3. Sketch your page so the information provides unity, variety and hierarchy.

4. Choose your colors and fonts wisely.

5. Match your graphic or visual element to the purpose of your content.

6. Make your content sharable.


Read the full article to find out more about these suggestions and additional links to infographic information and resources.

No comment yet.
Scooped by Kim Zinke (aka Gimli Goose)
Scoop.it!

Telling Your Story Through Infographics | Wild Apricot Blog

Telling Your Story Through Infographics | Wild Apricot Blog | How to find and tell your story | Scoop.it

Not only can an infographic help tell your data story but they can also increase traffic to your organization's website.


When can you use infographics?  Here are three ideas to get you thinking:

- Visualize data

- Illustrate survey highlights

- Graphically represent your organization’s history


Read the full article to find more details, ideas and resources.

No comment yet.
Scooped by Kim Zinke (aka Gimli Goose)
Scoop.it!

Data Visualization and Infographics: Using Data to Tell Your Story | Idealware

A look at the difference between "data visualization" and "infographics", and includes a few good examples of tools to help you create both.


Data visualizations take complex sets of data and display them in a graphical interface – for example, in a chart or on a map – which allows the user to gain deeper insight into patterns and trends. Infographics use data visualizations in concert with text and other tactics to tell a story, make a point or communicate a concept.

No comment yet.
Scooped by Kim Zinke (aka Gimli Goose)
Scoop.it!

INFOGRAPHIC: Photos, Videos Are The Best Way To Tell Stories On Facebook | AllFacebook

INFOGRAPHIC: Photos, Videos Are The Best Way To Tell Stories On Facebook | AllFacebook | How to find and tell your story | Scoop.it

On Facebook's top 10 brand pages, photos and video drive the most engagement.


The numbers don't lie - a brand's story is best framed online wiht photos and video.

- Videos are shared 12 times more than links and text posts combined.

- Photos are liked twice as much as text posts.

No comment yet.
Scooped by Kim Zinke (aka Gimli Goose)
Scoop.it!

10 Steps To Designing An Amazing Infographic | FastCoDesign

10 Steps To Designing An Amazing Infographic | FastCoDesign | How to find and tell your story | Scoop.it

Information can be useful--and even beautiful--but only when it’s presented well. In an age of information overload, any guidance through the clutter comes as a welcome relief. That’s one reason for the recent popularity of information graphics.


The article fully describes Hyperakt's process on how they go about creating an infographic in these 10 steps:

1. Gathering data

2. Reading everything

3. Finding the narrative

4. Identifying problems

5. Creating a hierarchy

6. Building a wireframe

7. Choosing a format

8. Determining a visual approach

9. Refinement and testing

10. Releasing it into the world

No comment yet.
Scooped by Kim Zinke (aka Gimli Goose)
Scoop.it!

The History of Content Marketing [Infographic] - Corporate Storytelling is Not New | Content Marketing Institute

The History of Content Marketing [Infographic] - Corporate Storytelling is Not New | Content Marketing Institute | How to find and tell your story | Scoop.it

An infographic detailing the history of content marketing in timeline form. Includes the start with John Deere in 1895 through Coca-Cola in the near future.

No comment yet.
Scooped by Kim Zinke (aka Gimli Goose)
Scoop.it!

Infographics for Nonprofits: The New Storytelling | Community Organizer 2.0

Infographics for Nonprofits: The New Storytelling | Community Organizer 2.0 | How to find and tell your story | Scoop.it

What are the story elements an infographic can use to be more effective?

It needs to be emotionally engaging in ways that offer people a way to make a difference Metphor A beginning, middle & end with a story arc Statement of a problem and ways for resolution Story triggers -- graphics and words that trigger stories within the minds of viewers A point, a key message Suggested actions to take


Not all infographics need to tell a story. Before embarking on creating an infographic, ask yourself the following strategic questions:

Who is my target audience? What important information does my target audience need or want to hear? Is the purpose of the infographic to share information, educate people, or create a context for understanding an issue? Is the purpose of the infographic to spark action -- either donations, support, or advocacy? What is my key message? What do I want my viewers to take away from the experience?


If you answered YES to #4, then you need your infographic to tell a story.  If you answered YES to #3, then your infographic only needs to convey information.


Go read the article for more great infographic insights.

No comment yet.